
TL;DR
If you only track 10 maintenance KPIs for strata, make them these:
- Work order response time
- Time to completion
- First-time fix rate
- Repeat work rate
- Preventive maintenance (PM) completion rate
- Overdue PM count and which assets are affected)
- Emergency vs planned work ratio
- Maintenance cost per lot or per m²
- Quote-to-approval cycle time
- Vendor performance score for quality, speed, and compliance
If you’re already collecting these, even imperfectly, you’re ahead of most portfolios.
If you manage strata maintenance long enough, you’ll notice a funny pattern: the buildings that run smoothly usually aren’t “lucky”. They’re measurable. Someone is tracking the right maintenance KPIs, spotting problems early, and nudging the system back into shape before it turns into a week of emergency callouts and unhappy residents.
On the flip side, when a building feels chaotic, it’s rarely because the team doesn’t work hard. It’s because nobody can clearly answer questions like:
- Are we responding fast enough?
- Are we actually fixing problems, or just closing tickets?
- Are we doing enough planned maintenance, or living in reactive mode?
- Which contractors are consistently reliable (and which are quietly hurting us)?
- Are costs rising because the building is ageing, or because our process is leaky?
That’s what this guide is for. Below is a practical, strata-friendly set of strata KPIs you can track to improve outcomes, without turning your week into a reporting project.
Why KPIs matter in strata maintenance
Most strata managers don’t need more data. You need fewer numbers that actually influence decisions. The goal of strata KPIs isn’t to produce pretty charts; it’s to run your maintenance like a well-managed system.
A good KPI set helps you reduce repeat issues and resident frustration, cut emergency callouts, improve contractor accountability, and spot risk before it becomes a compliance or insurance nightmare.
Where dashboards go wrong is when they track activity instead of outcomes. For example, “number of work orders raised” might show you’re busy, but it doesn’t prove the building is healthier. The trick is choosing a small group of maintenance KPIs that reflect speed, quality, prevention, cost, compliance, and supplier reliability.
Think of it like this: strata maintenance has three stakeholders that matter every day: residents, assets, and vendors. As a strata manager, your KPI set should cover all three.
Let’s walk through them.
1. Work order KPIs
Work orders are the heartbeat of strata maintenance. If this part is messy, everything downstream gets messy too: vendor allocation, resident updates, invoicing, reporting. These maintenance KPIs help you see whether your system is coping or quietly drowning.
Work order volume
This KPI answers the question: how many new requests are coming in? Track it over time.
It helps you identify seasonal patterns like storms, summer HVAC, and end-of-year wear. It’s an early signal for building changes, such as ageing assets and tenant turnover, keeping committees grounded in reality.
The key is not to treat volume as “good” or “bad”. Treat it as context. Pair it with quality KPIs to see whether increased volume is causing rushed fixes.
Response time
This is one of the most important strata KPIs because it’s directly tied to resident trust. Even when a job can’t be completed immediately, residents want to know they’ve been heard.
This shows the time from request logged to assignment/acknowledgment. It matters because fast response reduces complaint escalation, and also lowers “chasing” emails and calls.
The key is to separate the response time for urgent vs non-urgent jobs. Otherwise, urgent work hides slow handling of routine work.
Time to completion
This tells you how quickly issues are actually resolved. It reveals bottlenecks: approvals, vendor availability, access, and parts. It’s a better indicator of service level than “jobs closed.
You can make it more useful by segmenting it by building, service category, and priority level.
Backlog size and backlog ageing
This is one KPI committees understand immediately.
Backlog ageing is where reputational risk starts. A small backlog with old jobs is often worse than a large backlog with fresh jobs
Two numbers you need to understand here are: how many jobs are open, and how long they’ve been open.
Reopen rate
A reopened job usually means one of three things. The fix didn’t work, the scope wasn’t fully addressed, or the communication around what ‘done’ means was unclear.
Reopen rate is one of those quiet KPIs that often exposes bigger process issues.
2. Quality KPIs
Strata portfolios get expensive when the same issues come back again and again. Quality KPIs are the difference between maintenance that feels stable and maintenance that feels like a never-ending loop.
First-time fix rate
This measures the percentage of jobs resolved without a second visit or follow-up fix. It’s important because it reduces vendor callouts and resident disruption. It’s also one of the clearest indicators of workmanship and job scoping
If you want a one-number quality KPI, this is it.
Repeat work rate
Repeat work rate is your reality check. It cuts through the “ticket closed” illusion.
It the issue reopens in 30 days, it shows a short-term quality issue. If it reopens in 90 days, it shows a longer-term durability issue.
This KPI becomes powerful when you tag repeat work properly – same asset, same location, same fault type.
Callback/defect rate after completion
This overlaps with repeat work but focuses more on jobs that require a correction.
It shines a light on poor scoping, rushed fixes, or vendor capability mismatches. It supports objective conversations about vendor performance.
Resident satisfaction score
This doesn’t need to be fancy. A simple 1–5 rating after completion works well.
A resident’s “satisfaction” is often 50% workmanship and 50% communication. It highlights buildings where expectations aren’t being met, even if work is being completed
If you do collect this KPI, use it carefully. Don’t punish vendors for things they can’t control, like delayed approvals. Use it to spot patterns.
3. Preventive maintenance KPIs: where savings actually happen
If reactive maintenance is the tax, preventive maintenance is the investment. Most strata portfolios know this in theory, but the reality is: planned work gets pushed down the list until the building forces your hand.
That’s why preventive maintenance needs measurable maintenance KPIs.
Preventive maintenance (PM) completion rate
This is simply scheduled PM tasks vs on-time completed PM tasks. It correlates strongly with fewer emergencies and longer asset life. It protects compliance and warranty conditions for many systems.
To make it strata-friendly, show a PM completion rate per building, and highlight exceptions on what’s overdue and why.
Overdue PM count
A single overdue PM on a critical asset can be more important than 25 overdue low-risk tasks. So don’t just track “overdue”. Track what is overdue, and how risky it is.
Examples of “critical assets” in strata include fire safety systems, lifts, pumps, backflow prevention, and access control/security systems.
Emergency vs planned work ratio
This is one of the most important strata KPIs because it tells you whether the building is being managed proactively or constantly reacting.
A simple formula is: emergency jobs ÷ total jobs.
It’s important because emergency work is usually more expensive, disruptive and often done in a rush. Even reducing reactive work by a small percentage can make a big difference to budget and stress levels.
Inspection completion rate
Depending on the building, you’ll likely have recurring inspection obligations like fire safety and other essential checks.
This KPI is about audit-readiness: Are required inspections completed and recorded on time?
Committees love this because it reduces fear. It’s proof the building is being looked after.
4. Financial KPIs
Financial reporting in strata is often where things get tense, especially when committees are watching budgets closely. The best financial maintenance KPIs don’t just show totals; they show drivers.
Maintenance spend vs budget
The easiest way to do this is compare monthly/quarterly spend vs budget, plus a short explanation of variance. This keeps the story clear and helps committees understand whether overages are due to unavoidable failures or preventable reactive work.
Maintenance cost per lot
This KPI helps with building comparisons and trend tracking in the same building.
It’s not about shaming a building for being expensive. Older or more complex buildings cost more. The value is in seeing whether costs are rising faster than expected, and why.
Cost by category
Breaking down spending by service category helps you focus improvement efforts. You know exactly what, plumbing, electrical, lift, HVAC, security, or grounds is costing you more on maintenance.
This not only highlights problem areas but also informs long-term capex planning.
After-hours callout spend
This one is a sleeper KPI. After-hours spend often reveals preventable issues like delayed maintenance leading to failures, access issues forcing late attendance, or repeated urgent classification because routine work wasn’t scheduled.
Quote value vs final invoice variance
This is how you spot scope creep and poor quoting discipline. If invoices are consistently higher than quoted, this means scoping may be unclear, approval delays may be causing additional visits, or vendors may be under-quoting to win work.
This KPI is also useful for vendor performance conversations, because it brings objectivity.
5. Compliance & risk KPIs
In strata, risk isn’t theoretical. A missed compliance task can become an insurance issue, an audit issue, or a serious safety incident.
Good risk strata KPIs are simple and binary. They tell you when something is done or not done, and when a compliance is valid or missing.
Compliance completion rate
This tracks whether essential compliance tasks are completed on schedule and recorded properly.
It protects residents and reduces liability. It helps with audits and committee confidence, and reduces scramble-mode when something is requested urgently.
Supplier compliance rate
This is about whether vendors have current licences, insurances, safety documentation, and inductions or site requirements.
It reduces risk exposure for the owners corporation and prevents allocation delays.
Even if you don’t publish this KPI externally, tracking it internally makes your process smoother.
Incident and hazard reporting rate
This KPI is less common but very useful for larger sites. It tells you how many hazards/incidents are being reported, and whether they are being addressed.
It’s not about proving a building is “unsafe”. It’s about proving hazards aren’t ignored.
6. Vendor performance KPIs
If you want to improve outcomes without working 20% harder, improve vendor performance. Vendors are a massive lever in strata maintenance; quality, speed, compliance, resident experience, and cost control all live here.
The problem is that many strata teams rely on memory and anecdotes like “They’re usually good,” “I feel like they’re slow lately,” and “Residents keep complaining.”
KPIs make it fair and factual.
The core vendor performance metrics to track
Here are the most practical vendor performance KPIs for strata:
On-time attendance rate
Did they show up when they said they would?
Average time to complete
How long do they take to close jobs, relative to others?
First-time fix rate
Are they resolving issues properly?
Callback/rework rate
How often do their jobs require correction?
Quote turnaround time
How fast do they provide quotes when needed?
Compliance completeness
Are licences and insurance current and easy to access?
Job rating score
A simple manager/resident rating after completion.
How to score vendor performance
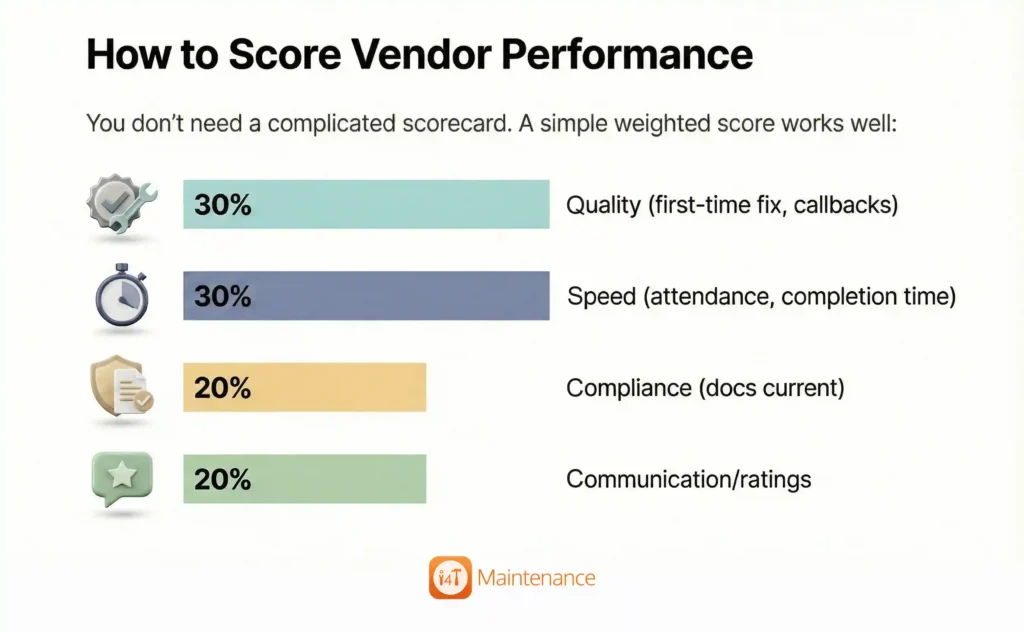
You don’t need a complicated scorecard. A simple weighted score works well:
- 30% quality (first-time fix, callbacks)
- 30% speed (attendance, completion time)
- 20% compliance (docs current)
- 20% communication/ratings
Even if you never show the “score” to vendors, it helps you decide who gets more work, who needs coaching, and who should be replaced.
When to coach vs replace
KPIs help you see patterns over time. Coach when performance dips temporarily, or the vendor is strong in one area but weak in another. However, you ned to replace when you observe repeated poor quality, frequent callbacks, unreliable attendance, or compliance issues.
Most committees will support vendor changes when you can show the story with data.
7. Communication KPIs
Many maintenance complaints aren’t really about maintenance. They’re about silence. Residents can tolerate delays when they understand what’s happening, when it’s scheduled, and what the next update will be.
That’s why communication belongs in your maintenance KPIs set.
Jobs with no update in X days
Track how many open work orders haven’t had an update, in 3 days for urgent work and 7–14 days for non-urgent work.
This KPI predicts complaints before they happen
Follow-up count per job
If you can track it, try to find how many times residents/committee had to chase for updates.
A high follow-up count usually means unclear ownership, delayed approvals, and vendor communication gaps.
Quote-to-approval cycle time
This is the hidden bottleneck KPI.
A job can be “slow” due to allocation delay, slow quote or attendance, or slow approvals.
Tracking quote-to-approval time makes the delay visible without blame on managers, vendors or the committee.
KPIs are your shortcut to calmer maintenance
The best strata KPIs don’t just make reporting easier; they make maintenance calmer. When you track the right maintenance KPIs, you stop guessing, you spot repeat problems earlier, you reduce reactive work, and you hold suppliers to clear expectations through measurable vendor performance.
And when committees ask the hard questions, “Why is spending up?” “Why are residents unhappy?” “Why is this job taking so long?” You can answer with clarity instead of stress.
Want to track the right maintenance KPIs without messy spreadsheets?
i4T Maintenance helps strata managers manage work orders end-to-end, from request handling and supplier allocation to work order tracking, resident communication, supplier compliance, invoicing, and KPI-ready reporting. If you’d like, you can use i4T Maintenance to create a clean monthly dashboard that committees actually understand.
FAQs
Maintenance KPIs are metrics that show how well maintenance is being managed: speed, quality, cost, compliance, and planned vs reactive work.
Start with response time, time to completion, backlog ageing, PM completion rate, emergency vs planned ratio, and vendor performance.
Track on-time attendance, completion speed, first-time fix rate, callback rate, compliance documents, and a simple job rating score. These are practical vendor performance measures.
Usually, 10-12 core maintenance KPIs are enough. More often creates noise and extra admin.
Review KPIs weekly internally to manage the backlog, and monthly for committees to show trends, risks, spend, and vendor performance.