
Strata managers often face an overwhelming amount of maintenance data, but what they really need is the right data to make smart decisions. The best field service management (FSM) dashboards are not about showing raw numbers but providing clear insights that help spot delays, reduce recurring problems, and improve contractor performance. This leads to better service outcomes for residents and clearer reporting for strata committees. Understanding which FSM dashboard metrics matter and why they do can transform how strata managers handle maintenance, from urgent repairs to ongoing preventative care.
What Strata Managers Need From an FSM Dashboard
An FSM dashboard tailored for strata management should do more than just track volumes of work orders. It needs to offer real visibility across multiple properties, helping managers make faster, evidence-based decisions. With clear data on contractor performance, maintenance response times, and compliance status, strata managers can prioritise work effectively and hold contractors accountable.
Beyond just counting jobs done, the dashboard should feature meaningful field service management KPIs that measure service quality, operational efficiency, and risk factors like overdue safety checks or recurring faults. Effective dashboards support transparent reporting to owners and committees, providing the clarity needed to justify spend and demonstrate ongoing asset care.
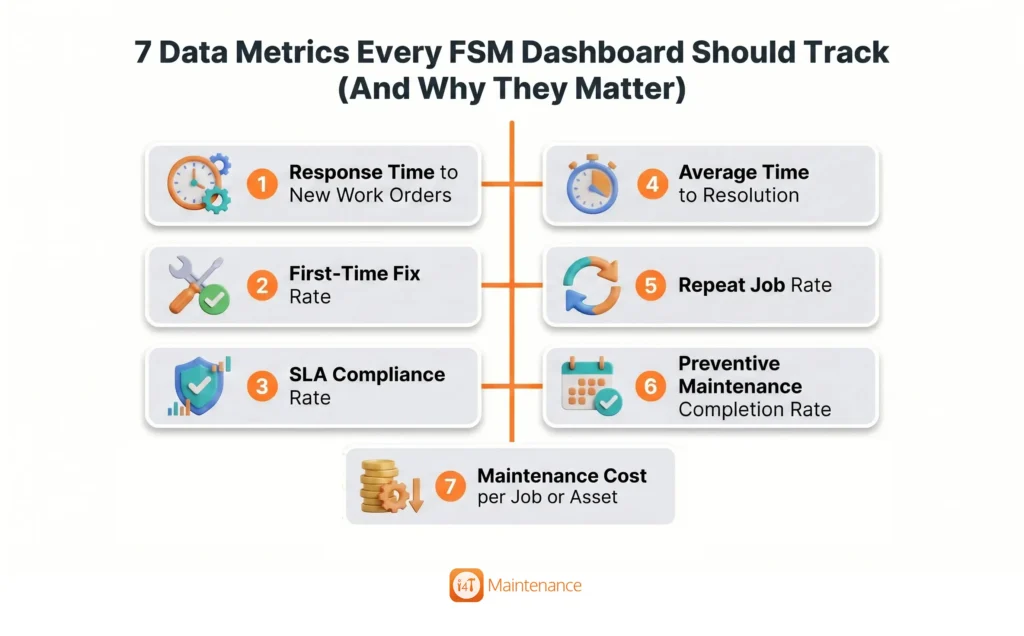
1. Response Time to New Work Orders
Response time reflects how quickly a contractor or maintenance team acknowledges and begins work after a new job order is logged.
It’s a critical FSM metric because residents and committees alike expect prompt attention to property faults, especially urgent issues like lift malfunctions, plumbing leaks, or power outages. When response times lag, resident satisfaction drops, and the risk of complications grows, particularly with after-hours emergencies. For strata managers, tracking response time helps highlight operational bottlenecks.
Slow responses can indicate poor contractor availability, communication gaps, or inefficient workflows, all of which need addressing to maintain trust and building safety.
2. First-Time Fix Rate
The first-time fix rate measures the proportion of maintenance issues resolved on the initial visit without requiring follow-up appointments.
This metric is hugely valuable for strata managers because each repeat visit disrupts residents and adds unnecessary costs. High first-time fix rates suggest that contractors arrive prepared, with the right tools and parts, and possess the skills needed to get the job done efficiently. Conversely, a poor first-time fix rate may point to inadequate contractor training, supply chain delays, or misdiagnosed problems.
Monitoring this metric helps strata managers reduce administrative burden, minimise resident inconvenience, and cap maintenance expenses by preventing unnecessary repeat jobs.
3. SLA Compliance Rate
Service Level Agreements (SLAs) set agreed timeframes for completing specific strata maintenance tasks, such as emergency fire safety checks or routine lift servicing.
The SLA compliance rate tracks how often contractors meet these time-bound commitments. For strata managers, this metric ensures contractors stick to legal and contractual obligations, helping avoid compliance risks or penalties. It’s especially important for repairs classified as urgent, like water leaks or safety hazards, where delays can have serious consequences.
Monitoring SLA compliance also gives managers leverage to demand better accountability and maintain consistent service standards, which all contribute to protecting resident well-being and asset integrity.
4. Average Time to Resolution
While response time measures how quickly a job is acknowledged, average time to resolution looks at how long the entire process takes, from logging the issue to completing the repair or maintenance.
This metric paints a clearer picture of the resident’s experience and the effectiveness of the maintenance workflow. Delays in resolution can arise due to many strata-specific challenges: waiting for committee approvals on costly repairs, sourcing specialised parts for ageing building systems, or coordination issues between multiple contractors.
Tracking this metric lets strata managers identify where holdups occur and target improvements in communication or supply chains, ultimately speeding up repairs and reducing ongoing frustration.
5. Repeat Job Rate
The repeat job rate reveals how often the same maintenance issue requires more than one job order over a set period.
A high repeat rate is a red flag signalling poor workmanship, temporary fixes, or unresolved underlying problems with building assets. For strata managers, persistent recurring jobs can quickly escalate maintenance costs and fuel resident complaints. This metric helps highlight problem areas like lifts prone to breakdowns, plumbing hotspots, or faulty communal lighting. By tracking repeat jobs, strata managers can decide whether contractors need additional training, if alternative suppliers should be engaged, or if assets require replacement rather than repair.
Addressing these repeating faults forms a key part of smarter, cost-effective strata maintenance.
6. Preventive Maintenance Completion Rate
Preventive maintenance is critical in strata settings where common assets such as lifts, fire systems, HVAC units, pumps, and security infrastructure need regular checks to stay compliant and operational. This metric measures how consistently scheduled preventive tasks are completed on time.
Keeping this rate high reduces the volume of reactive repairs, extends asset life, and makes maintenance spending more predictable. For strata managers juggling multiple properties, an accurate preventive maintenance completion rate helps spot when contractors fall behind or when additional resources are needed.
Regular preventive care underpins safer, better-maintained buildings and avoids costly breakdowns or compliance breaches down the track.
7. Maintenance Cost per Job or Asset
Tracking maintenance cost per job or per asset delivers deeper insight than merely monitoring total spend. This metric enables strata managers to compare expenses across different buildings, asset types, or contractors.
By understanding cost variability, managers can investigate why some repairs are pricier, or cheaper, and assess value rather than just price. Sometimes, a cheaper repair job can lead to repeat visits, poorer outcomes, or resident dissatisfaction, skewing the true cost picture. Cost-per-job data helps inform budgeting, tendering decisions, and negotiating contractor rates, ensuring maintenance investment is both effective and economical for strata committees and owners.
Why FSM Dashboard Metrics Should Be Viewed Together
No single metric can capture the full story of strata maintenance performance.
For instance, a fast response time might look good on the surface but could be offset by long resolution times if contractors struggle to complete repairs quickly. Similarly, low job costs might seem positive but could be a result of low first-time fix rates leading to repeated work and unhappy residents.
Effective strata management comes from interpreting these key FSM dashboard metrics together, spotting patterns and trade-offs, and making decisions that balance speed, quality, cost, and compliance. This holistic approach helps avoid chasing numbers and instead focuses on improving the overall maintenance experience and outcomes.
Which Metrics Strata Managers Should Prioritise First
When first setting up or refining an FSM dashboard, strata managers should prioritise metrics that drive immediate operational improvements and resident satisfaction.
Starting with response time and first-time fix rate gives clear feedback on contractor performance and resident impact. SLA compliance rate follows closely to ensure urgent and compliance-critical work meets expectations. After that, the average time to resolution and repeat job rate become vital to uncover deeper workflow or quality issues.
Finally, preventive maintenance and cost metrics help with longer-term planning and budgeting. Focusing on this sequence builds a practical, actionable picture that supports day-to-day decisions and strategic maintenance management.
What a Good FSM Dashboard Should Let Strata Managers See
A strong FSM dashboard provides more than numbers — it offers clear visual insights and drill-down capabilities. Strata managers should be able to filter data by building, contractor, work order type, or priority to better understand where challenges lie. Seeing overdue work, jobs at risk of breaching SLAs, recurring faults by asset type, and trends over time all help paint a full picture. For example, managers might notice that one lift contractor consistently misses response targets or that plumbing faults peak before certain weather conditions. These insights allow proactive decision-making and targeted interventions, supporting improved service delivery and budget control.
Common Mistakes When Tracking FSM Performance Metrics
One common pitfall is tracking too many metrics without focusing on those that truly impact strata maintenance outcomes. Chasing activity volumes rather than quality or resident experience can produce confusing reports.
Another mistake is failing to separate urgent work from routine maintenance, which skews performance insight and hinders prioritisation. Strata managers sometimes overlook comparing contractors on key metrics, missing opportunities to increase accountability. Lastly, looking only at cost without linking it to quality or repeat jobs can lead to poor procurement decisions. Staying focused on a balanced, quality-driven metric set avoids these traps and supports better maintenance management.
Conclusion
The right FSM dashboard metrics empower strata managers to improve maintenance service delivery, reduce inefficiencies, and hold contractors accountable, a must-have for managing multiple properties where resident satisfaction and compliance are paramount.
By tracking metrics like response time, first-time fix rate, SLA compliance, and repeat job rates, managers gain critical insights into how maintenance work is performed and its impact on residents and budgets. Preventive maintenance and cost metrics provide the broader view needed for smart planning and spending.
Strata managers looking to streamline their maintenance workflows and lift contractor performance should consider smart tools like i4T Maintenance, which bring these key metrics together in one easy-to-use platform, tailored for strata management needs.
Frequently Asked Questions
Key metrics include response time, first-time fix rate, SLA compliance, average time to resolution, repeat job rate, preventive maintenance completion, and maintenance cost per job or asset.
Fast response times, high first-time fix rates, and timely resolution of issues greatly enhance resident satisfaction by reducing disruptions and delays.
They provide clear data on contractor accountability, work quality, compliance adherence, and efficiency, enabling better performance management and informed decisions.
Preventive maintenance reduces emergency repairs, extends asset life, keeps buildings compliant, and helps strata managers manage budgets more predictably.
Regular reviews monthly or quarterly help track trends, identify issues early, and ensure maintenance workflows remain efficient and effective.