
Year-end is a busy time for strata managers – budgets to finalise, AGMs to prepare for and a long list of “we’ll deal with that later” items finally catching up. But it’s also the perfect moment to pause, look back at how your buildings performed and decide what you want 2026 to look like.
A structured Year-End Strata Maintenance Review helps you step out of day-to-day firefighting and see the bigger picture. Instead of just reacting to complaints and breakdowns, you use data to answer a simple question:
Is our maintenance actually working for the building, the budget and the people who live there?
In this article, we’ll walk through 7 key metrics every strata manager should track before 2026, show you how they fit into a practical year-end strata maintenance review checklist, and explain where a platform like i4T Maintenance can make your life much easier.
Why a Year-End Strata Maintenance Review Matters
A good year-end review does more than tick a compliance box. It creates a clear story you can share with committees and owners: what went well, what didn’t and what you’re going to do differently next year. It’s also the best way to make sure you’re meeting your common property maintenance responsibilities without blowing the budget or burning out your team.
At the heart of this is understanding preventive vs reactive maintenance in strata. If most of your time and money is going into urgent repairs, you’ll see more disruptions, more complaints and more surprises at budget time. If you’re steadily increasing preventive work, planned servicing, inspections, and asset care, you’ll see steadier costs and fewer dramas.
When you measure the right things, you move from guesswork to evidence-based decisions. That makes your job easier and your reporting to owners far more convincing.
In your year-end review, aim to:
- Look at how the building actually performed, not just how busy you were
- Check whether your processes are helping or hindering maintenance
- Identify a small number of clear priorities for 2026
- Back up your recommendations with simple, easy-to-read metrics
Metric #1: Preventive vs Reactive Maintenance Ratio
This is the foundation of how to measure strata maintenance performance. It tells you whether your buildings are being looked after proactively or just patched up when something breaks. Over a full year, the numbers are often very revealing: what feels “normal” can actually be a very reactive way of operating.
To calculate the ratio, you look at all maintenance jobs for 2025 and classify them as either preventive (planned servicing, routine inspections, scheduled upkeep) or reactive (breakdowns, urgent repairs, complaints). The goal isn’t perfection; it’s simply to understand where you are now so you can consciously shift the balance over time.
A healthier ratio means fewer surprises, better asset performance and often a calmer life for everyone involved. Even small shifts towards more preventive work can make a big difference over several years.
For your review, focus on:
- Percentage of total jobs that are preventive vs reactive
- Percentage of total maintenance spend on preventive vs reactive work
- Buildings where reactive jobs or costs are significantly higher than others
Metric #2: Response and Resolution Times
You can’t manage perception without managing speed. Owners and residents judge maintenance largely by how quickly things happen once they raise an issue. Tracking response and resolution times helps you understand whether your team and your trades are delivering a good experience for the people who actually use the building.
This metric should capture both your first response and the final fix. It’s not just about closing tickets quickly; it’s about realistic expectations. A simple “we’ve logged your request and assigned a contractor” within a reasonable timeframe often keeps people happy, even if the repair itself takes a bit longer.
Because it links directly to lived experience, this is one of the most powerful metrics every strata manager should track and one that committees can immediately understand.
At year-end, review:
- Average time from request logged to first response or action
- Average time from request logged to job completion
- How often are you meeting your own internal response and resolution targets
Metric #3: Work Order Completion Rate
It’s one thing to raise a work order; it’s another to see it through to completion. A year-end snapshot of how many jobs were completed on time, late or not at all gives you a clear view of whether your maintenance process is actually working.
If you’re seeing a long list of overdue or still-open jobs at the end of the year, that’s a red flag. It may point to issues with contractor performance, unclear scopes of work, delays in approvals, or simply too much manual tracking. A solid completion rate tells you that requests aren’t slipping through the cracks and your common property maintenance responsibilities are under control.
This metric is also a great conversation starter with trades and your internal team; it’s hard to argue with numbers that show consistent delays.
In your review, pay attention to:
- Percentage of work orders completed by their due date
- Number of jobs still open or overdue at 31 December
- Patterns by contractor, building or job type where delays are common
Metric #4: Budget vs Actual Maintenance Spend
Numbers tell the financial story behind your maintenance decisions. Comparing your approved maintenance budget with actual spend over the year helps you see whether your assumptions were realistic – and how you might need to adjust them for 2026.
This is a core part of how to measure strata maintenance performance from a financial perspective. If you consistently overspend because of unexpected failures, it may be a sign that you’re too reactive. If you’re consistently underspending, owners might be pleased now, but assets could be quietly deteriorating in the background.
By breaking spending down into categories, preventive, reactive, capital upgrades, compliance and safety, you can explain where the money actually went and why certain decisions need to be made next year.
For your year-end comparison, look at:
- Overall budget vs actual spend for maintenance in 2025
- Variances by category (preventive, reactive, capex, compliance)
- Buildings where overspends or underspends were particularly large or repeated
Metric #5: Defects, Recurring Issues and Call-Backs
If the same issue keeps reappearing in your system, it’s telling you something. Recurring problems and call-backs often point to deeper issues with workmanship, asset condition or the way jobs are being scoped and approved.
Tracking this metric gives you insight into quality, not just quantity. It highlights where your time and money are being wasted on repeat visits, and where residents are probably getting frustrated with déjà vu maintenance requests. It also helps you have more constructive conversations with trades: instead of vague complaints, you have very specific patterns.
From a practical standpoint, this is where having proper records pays off. When you can search by asset or location and see how many times you’ve dealt with the same issue, it becomes easier to justify a more permanent solution.
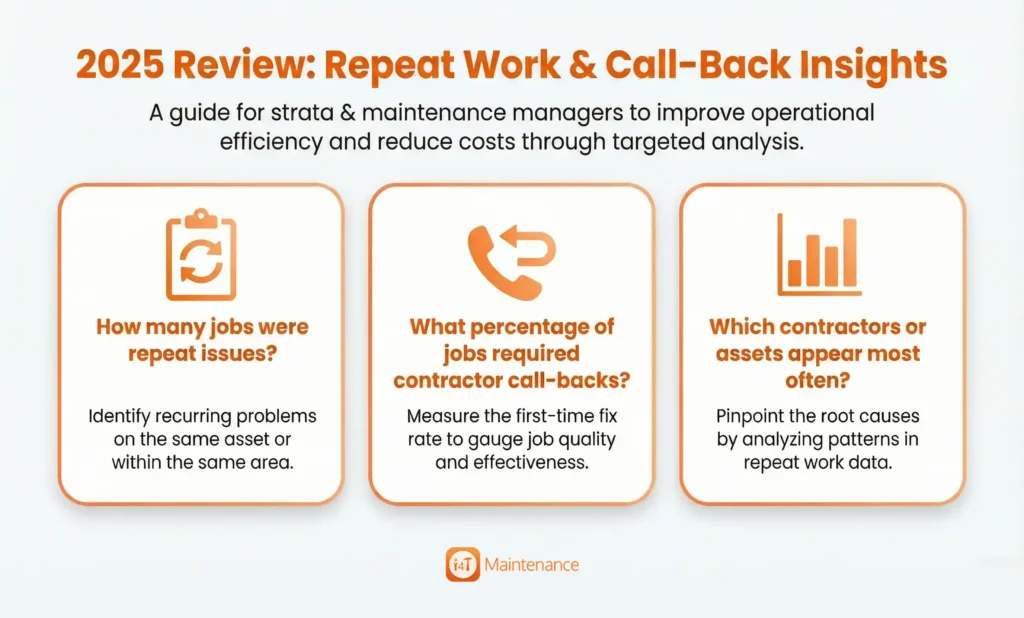
When you review 2025, consider:
- How many jobs involved repeat issues on the same asset or area
- The percentage of jobs that required contractor call-backs to fix properly
- Which contractors or asset types appear most often in repeat work
Metric #6: Compliance and Safety Task Completion
Compliance tasks are non-negotiable. Fire systems, lifts, essential safety measures, pool safety and other local requirements all sit under your common property maintenance responsibilities, and falling behind can have serious consequences.
This metric looks specifically at whether required inspections, tests and reports were completed on time throughout the year. It’s less about volume and more about reliability: are you consistently doing what you’re legally obliged to do, when you’re supposed to do it?
A strong track record here gives you confidence at audit time and peace of mind when talking to owners. It also helps you spot any weak points where reminders or processes need to be tightened.
In your compliance review, check:
- Percentage of scheduled compliance tasks completed by their due date
- Number of tasks completed late or missed entirely in 2025
- Any recurring problem areas where compliance activities are often delayed
Metric #7: Resident and Owner Satisfaction with Maintenance
The best metrics in the world won’t help if the people who live in and pay for the building feel dissatisfied. That’s why resident and owner satisfaction is a key part of how to measure strata maintenance performance in a holistic way.
You don’t need a complex research project. Simple satisfaction scores, short surveys or quick feedback questions after jobs can give you enough information to see whether you’re heading in the right direction. Combined with complaint patterns, they provide a clear picture of how your maintenance performance is perceived.
This metric is especially powerful when paired with the others. For example, improving response times and completion rates should, over time, show up as better satisfaction scores and fewer complaints.
As part of your year-end review, look at:
- Any satisfaction surveys or feedback you’ve collected during the year
- Trends in maintenance-related complaints vs compliments
- Buildings where dissatisfaction appears high compared to the metrics you’re tracking
Turning Metrics into a Year-End Strata Maintenance Review Checklist
Knowing the numbers is one thing; turning them into a practical plan is another. A good year-end strata maintenance review checklist makes it easy to repeat this process every year and to show committees that you’re managing their assets in a systematic way.
The checklist doesn’t need to be complicated. It just needs to guide you through collecting data, reviewing it, and deciding what to do next. When you build it around the 7 metrics above, you end up with a simple, repeatable framework that works across your whole portfolio.
This structure also makes reporting easier. Instead of a vague “maintenance went okay this year”, you can say, “Here’s how we performed against seven clear metrics, and here are the three things we’re going to improve in 2026.”
A simple checklist might include:
- Gather data on all 7 metrics for each building for the year 2025
- Identify key strengths and problem areas based on the numbers
- Choose 2–3 priority improvements per building for 2026
- Document any changes needed to processes, contractors or budgets
How i4T Maintenance Makes All of This Easier
Doing this kind of review using emails, spreadsheets and paper notes can be a real headache. It’s time-consuming, easy to miss things and hard to repeat year after year in a consistent way. That’s where a dedicated strata maintenance management software like i4T Maintenance can be a game-changer.
With i4T Maintenance, work orders, costs, compliance tasks, and communication with trades all live in one place. Jobs can be tagged as preventive or reactive, tracked from request to completion, and reported on across buildings and portfolios. Instead of piecing information together manually, you can generate reports that speak directly to the metrics every strata manager should track.
That means less time hunting for information and more time using it, whether that’s running your year-end strata maintenance review checklist, preparing for AGMs or answering committee questions with confidence.
With i4T Maintenance, you can:
- Track preventive vs reactive work and see trends over time
- Monitor response and resolution times by building, priority or contractor
- Compare budget vs actual spend with clear breakdowns
- Keep compliance calendars, reminders and records all in one system
Start 2026 with Clear Data and a Clear Plan
As the year comes to a close, it’s tempting to simply roll into the next one and hope things run more smoothly. But taking the time to run a proper Year-End Strata Maintenance Review can completely change the way you manage your buildings in 2026.
By focusing on these 7 key metrics, preventive vs reactive balance, speed, completion, spend, quality, compliance and satisfaction, you create a fair, transparent way to judge performance. You also give yourself solid evidence for your budget recommendations, capital works planning and process improvements.
Most importantly, you move away from being constantly reactive and towards a more planned, proactive approach that benefits owners, residents and your own workload.
If you’d like to make this whole process easier, more accurate and less stressful, it might be time to modernise your tools.
Ready to streamline your year-end review?
Book a demo of i4T Maintenance today and see how simple it can be to run your next Year-End Strata Maintenance Review with the right data at your fingertips.
FAQs
Preventive maintenance is planned work done before things break, such as routine servicing and inspections. Reactive maintenance is unplanned work carried out after a fault, breakdown or complaint, often urgent and more disruptive.
Seven useful metrics are: preventive vs reactive maintenance ratio, response times, resolution times, completion rates, budget vs actual spend, recurring issues and call-backs, compliance task completion, and resident/owner satisfaction.
Begin by listing the metrics you want to track, pulling the relevant data from your maintenance records or software, reviewing the results and then choosing a small number of improvement priorities for each building for the year ahead.
Software centralises requests, work orders, costs and compliance activities, making it easy to tag and track jobs, monitor performance and generate reports. This removes manual double-handling and reduces the risk of missing important tasks.
Not at all. Use your year-end review to understand where you’re most reactive, then start by introducing basic preventive servicing for your highest-risk or most problematic assets. As you show results, you can gradually expand your preventive program over the next few years.